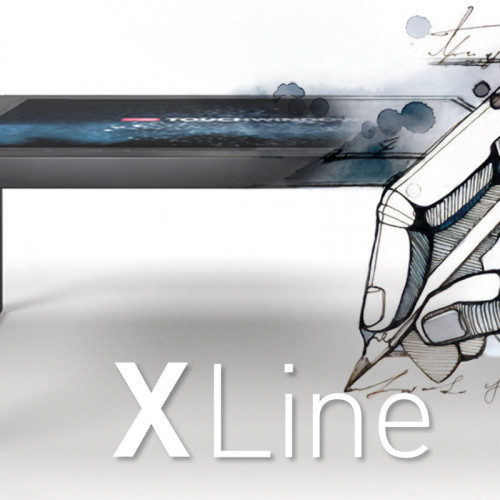
MEETING ROOM
Digital ecosystems for collaborative workspaces
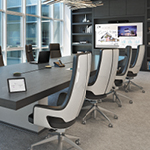
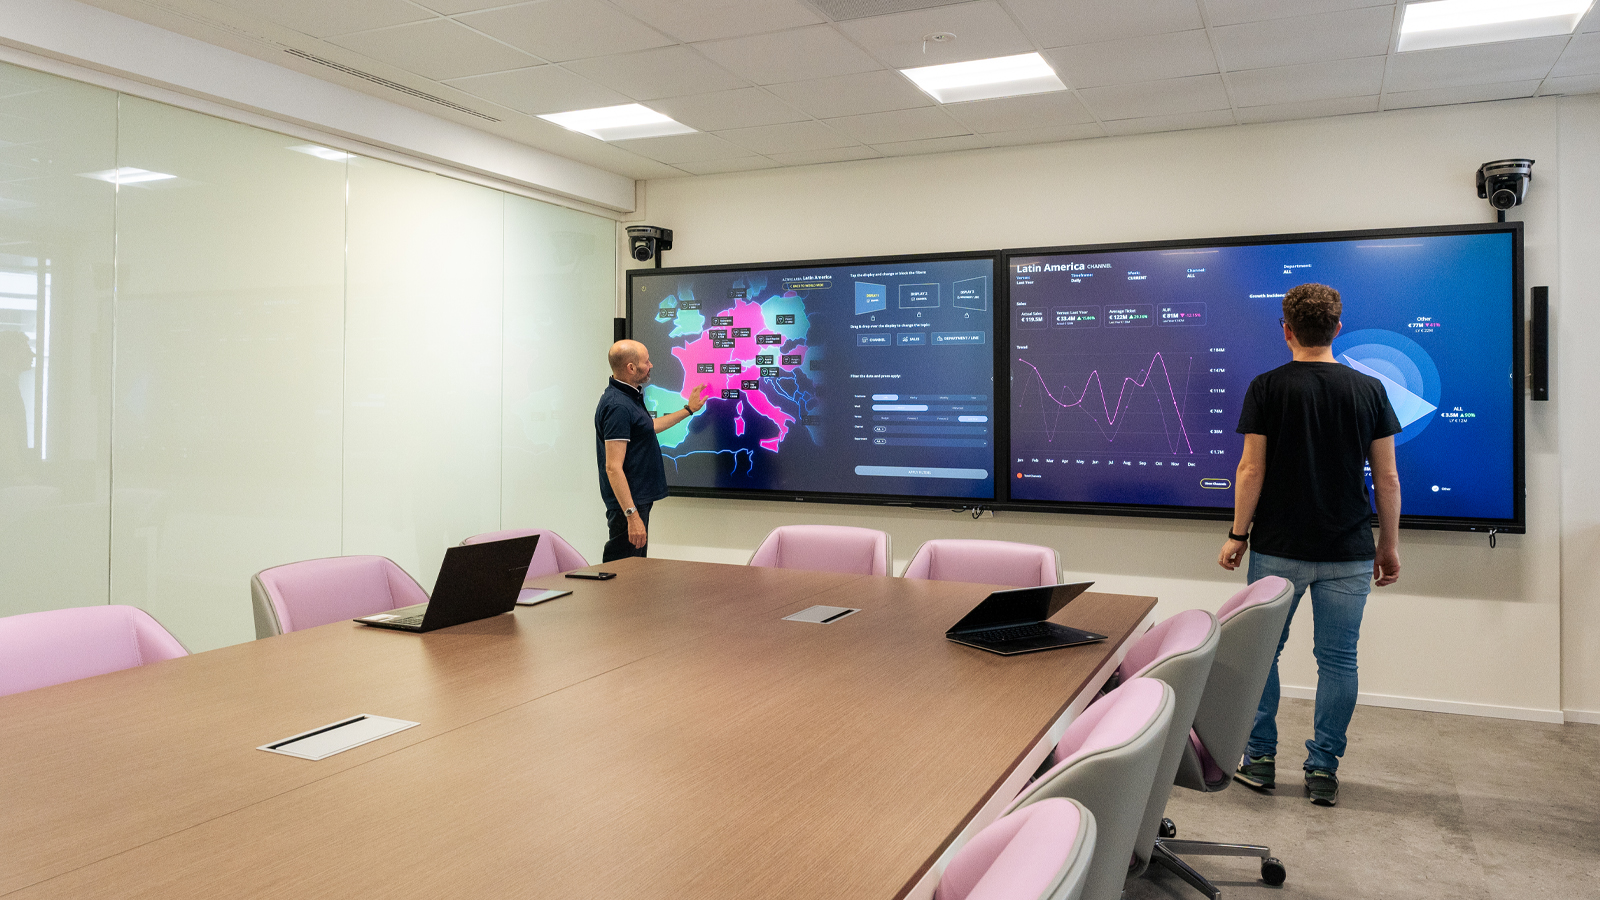
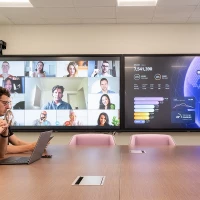
We design Meeting Rooms that integrate AVC hardware, software and automation solutions to physical environments, dedicated to sharing, collaboration and comparison.
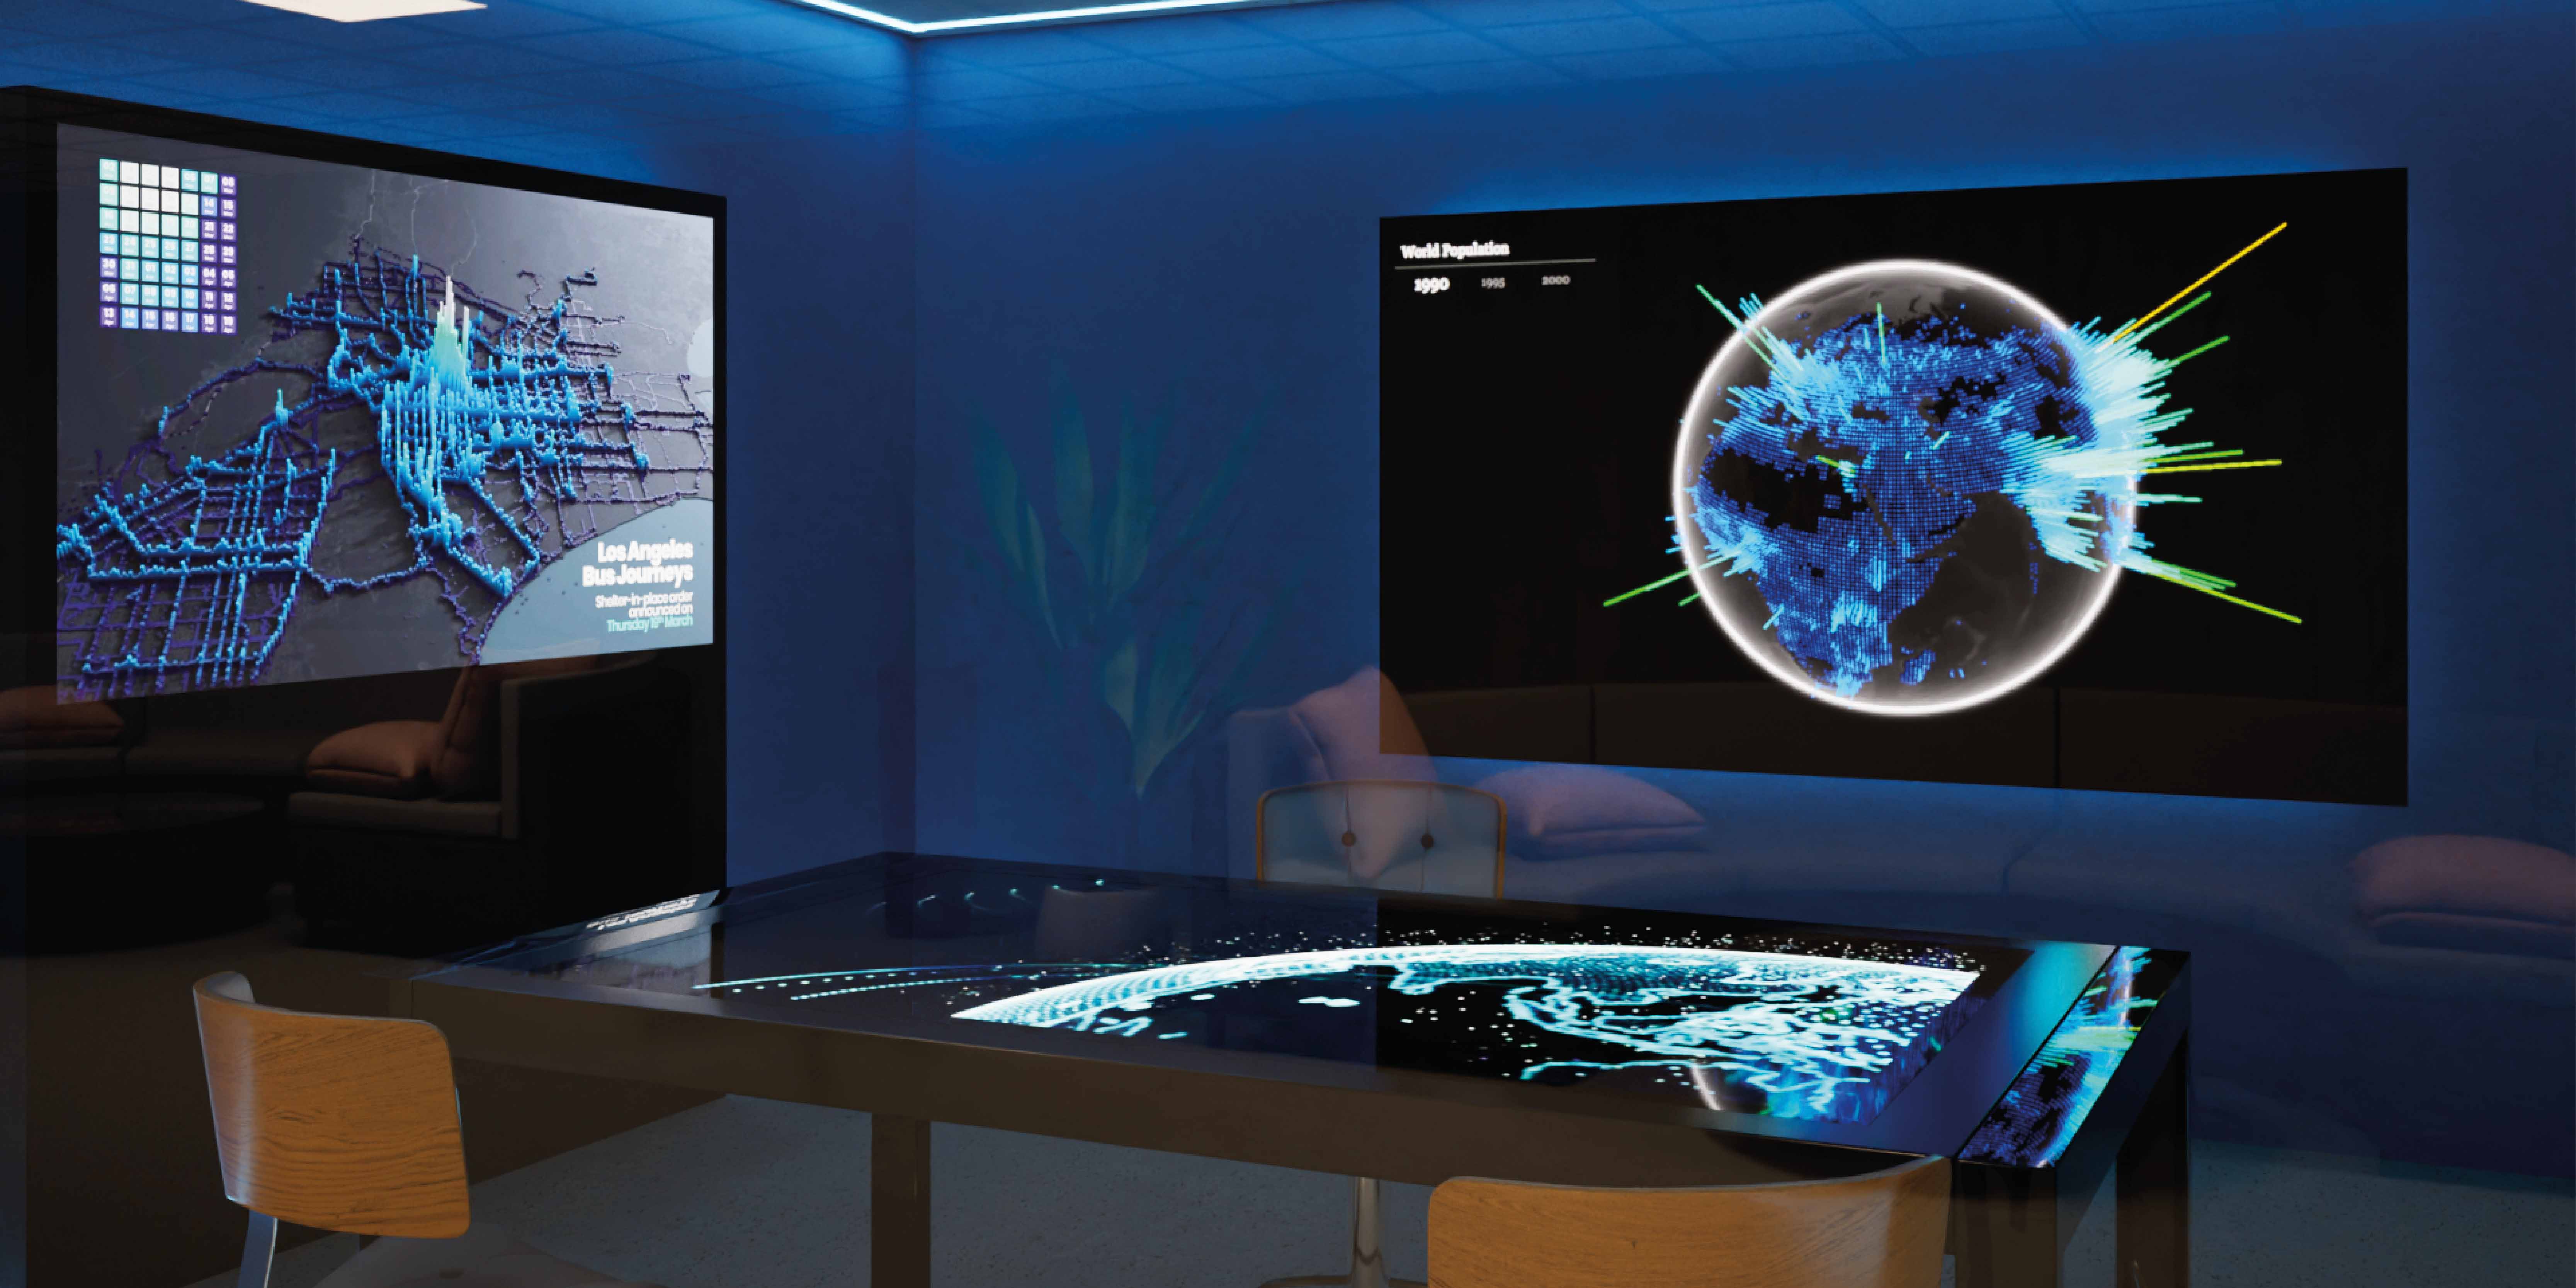
In the realm of data analysis, regardless of size (Small and Big Data), 3D Data Visualization emerges as a powerful tool for analyzing and interpreting complexity, identifying trends and related phenomena, and making informed decisions based on them.
In detail, 3D data visualization offers a graphical and spatial representation of data, making it easier to identify trends, synergies, and anomalies. This significantly improves the impact of strategic meetings and presentations to stakeholders.
The term "big data" refers to massive datasets that require specific analysis techniques and methods, allowing them to be transformed into actionable insights.
Big data visualization is an advanced form of “visual art” that uses visual elements like diagrams and conceptual maps to make large volumes of data easier to understand by revealing values and patterns. This is where the effectiveness of 3D Data Visualization lies.
Our interaction with the world around us has always been predominantly visual: from art and advertising to movies, our eyes are naturally drawn to colors, shapes, and patterns.
3D Data Visualization leverages this tendency, ensuring data interaction mirrors this reality.
While identifying trends in a complex graph may be effective and convenient, spotting trends or outliers by scanning through a spreadsheet filled with sequential data is much more challenging.
For companies operating in sectors where decisions need to be made quickly and based on detailed information, adopting advanced data visualization technologies is more than a necessity: it’s the future.
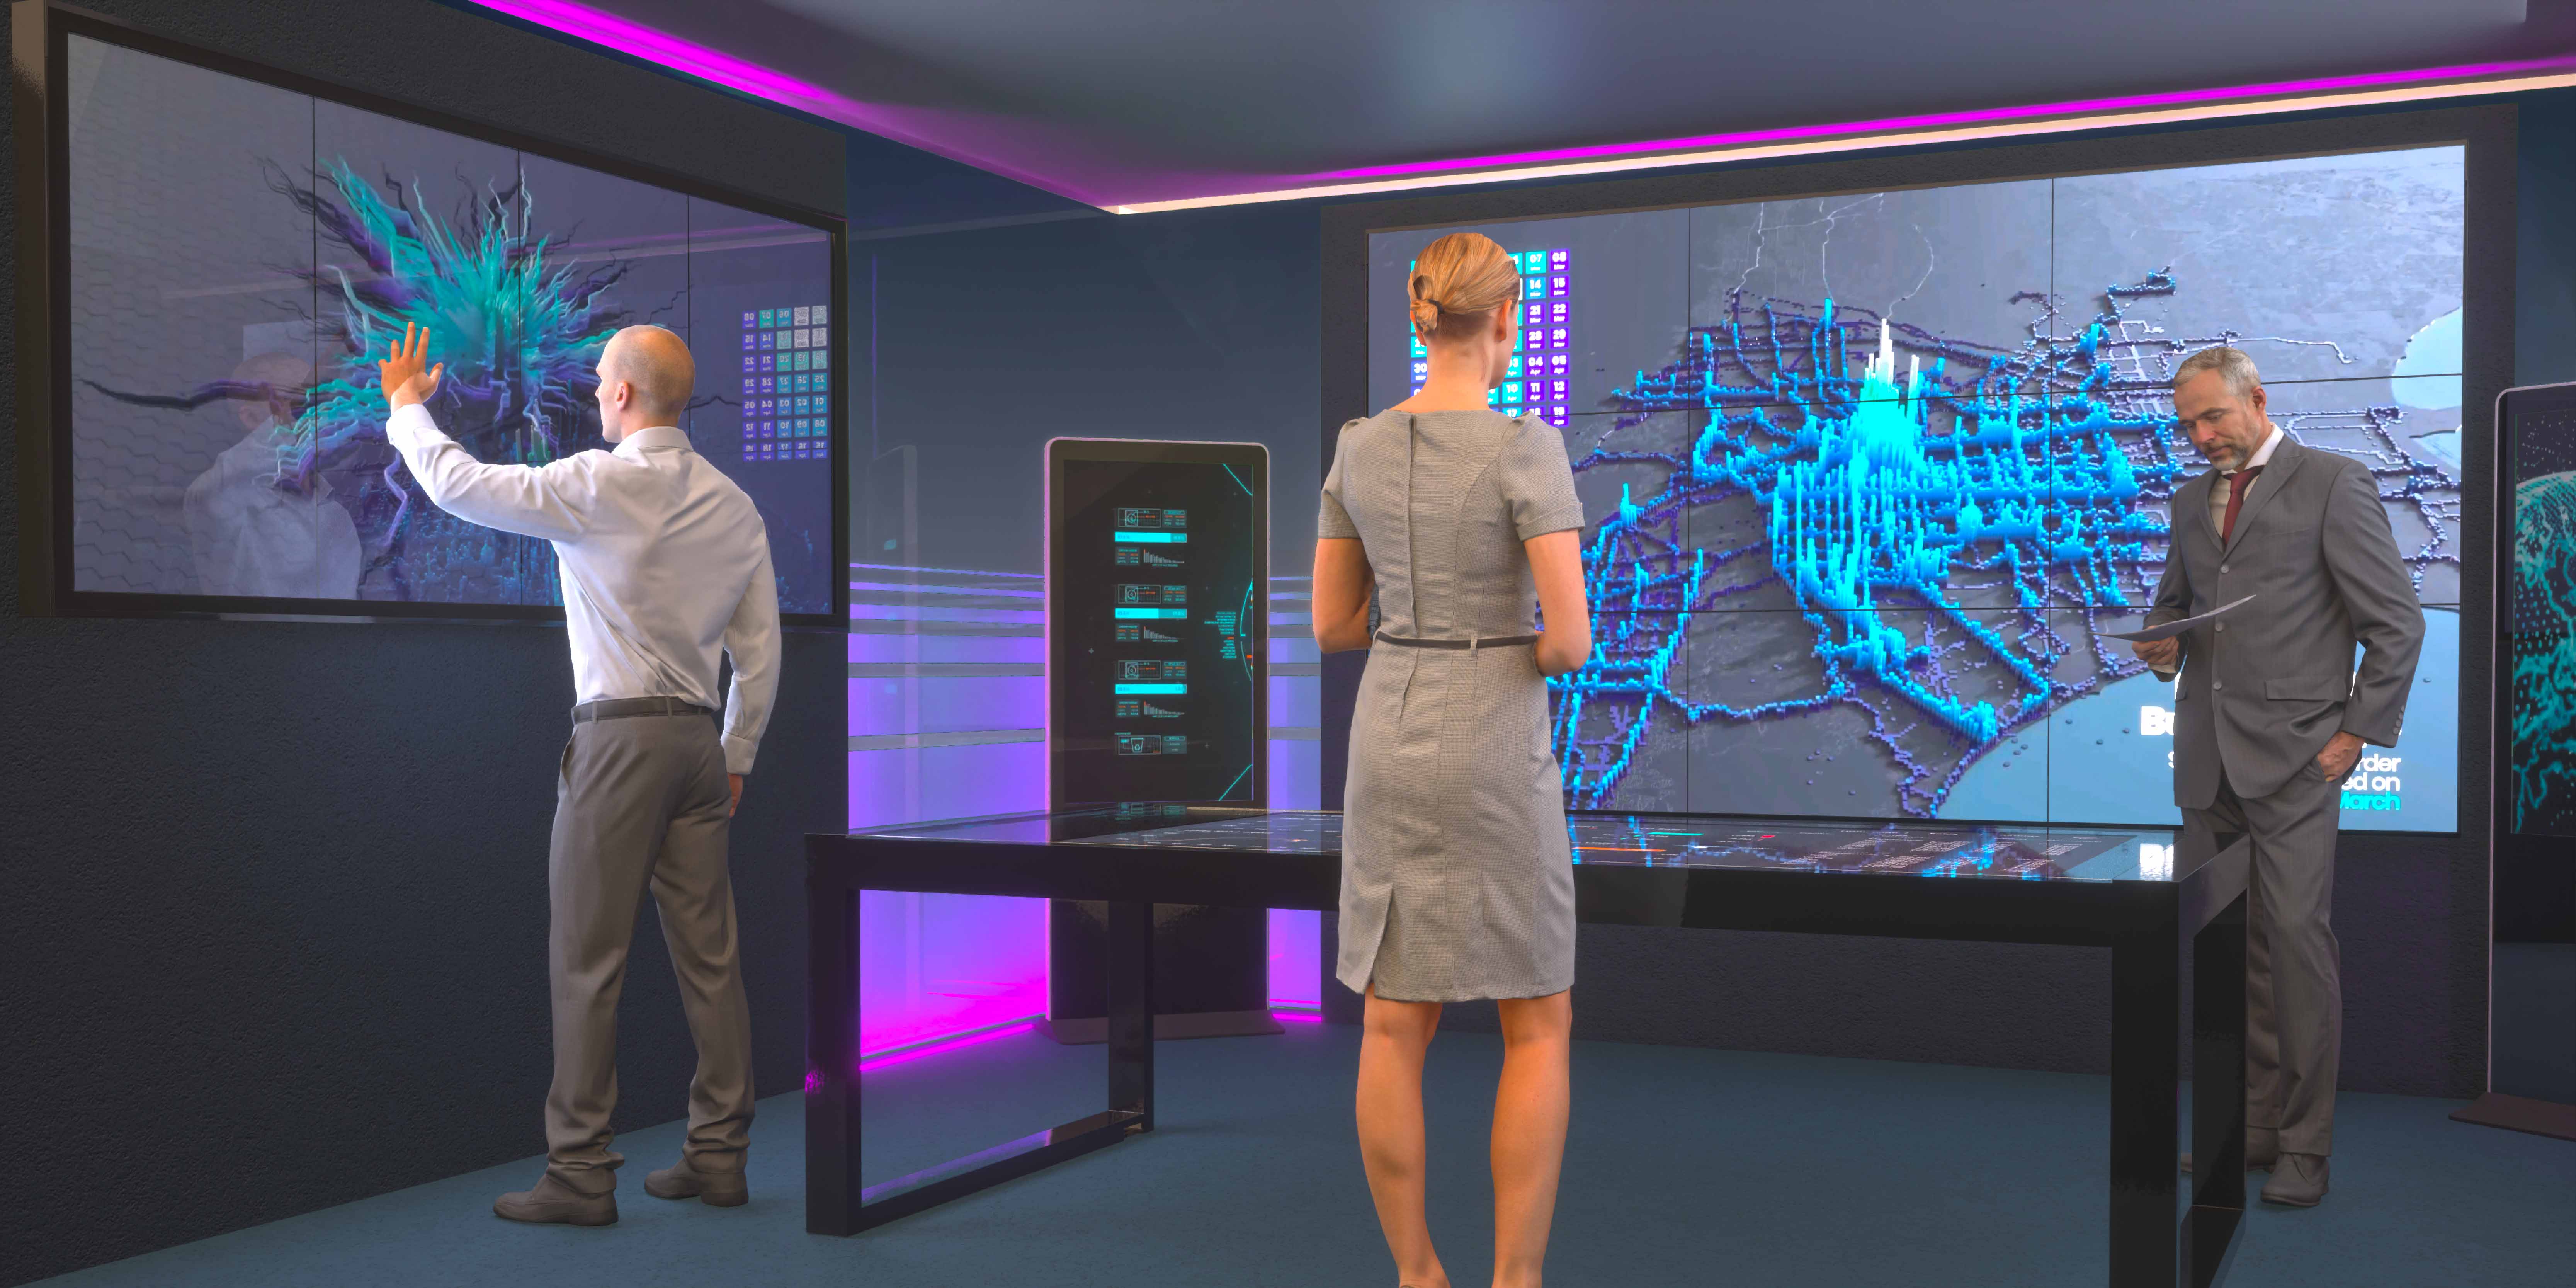
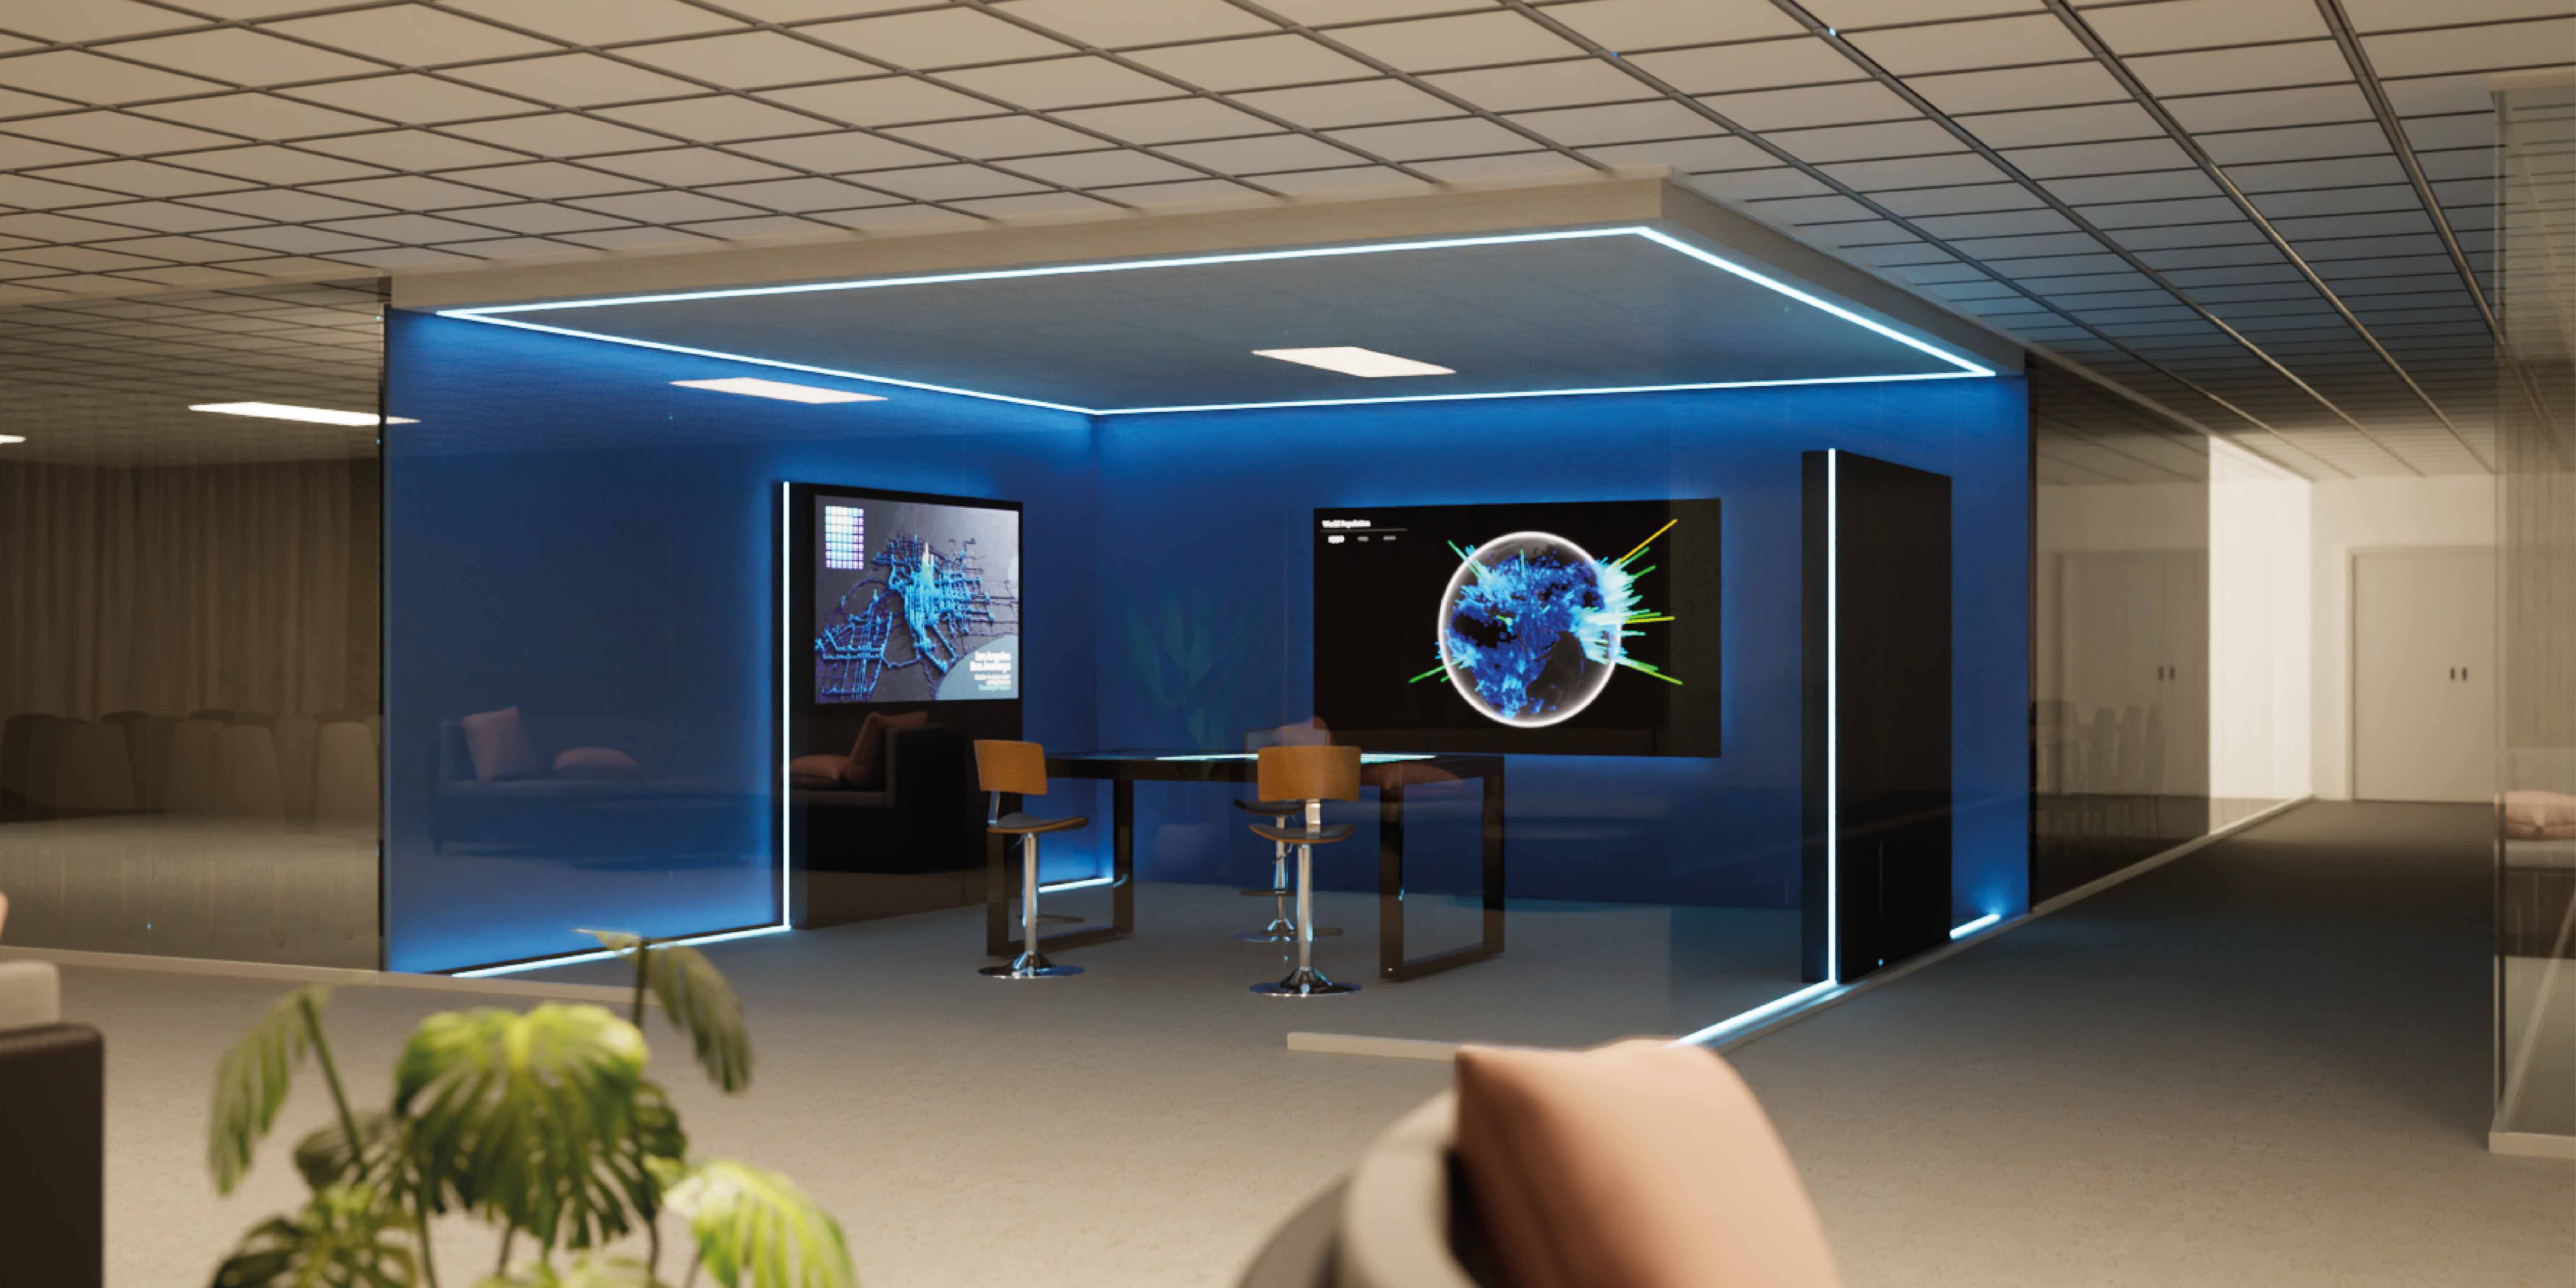
Combining 3D Data Visualization with interactive technologies takes data analysis to the next level. By utilizing drill-down techniques on graphs displayed on multi-touch, multi-user screens, users can interact with them to discover additional details through indirect and secondary-level analyses. The displayed data and related processing can be interactively and in real-time modified based on actions performed directly on the display.
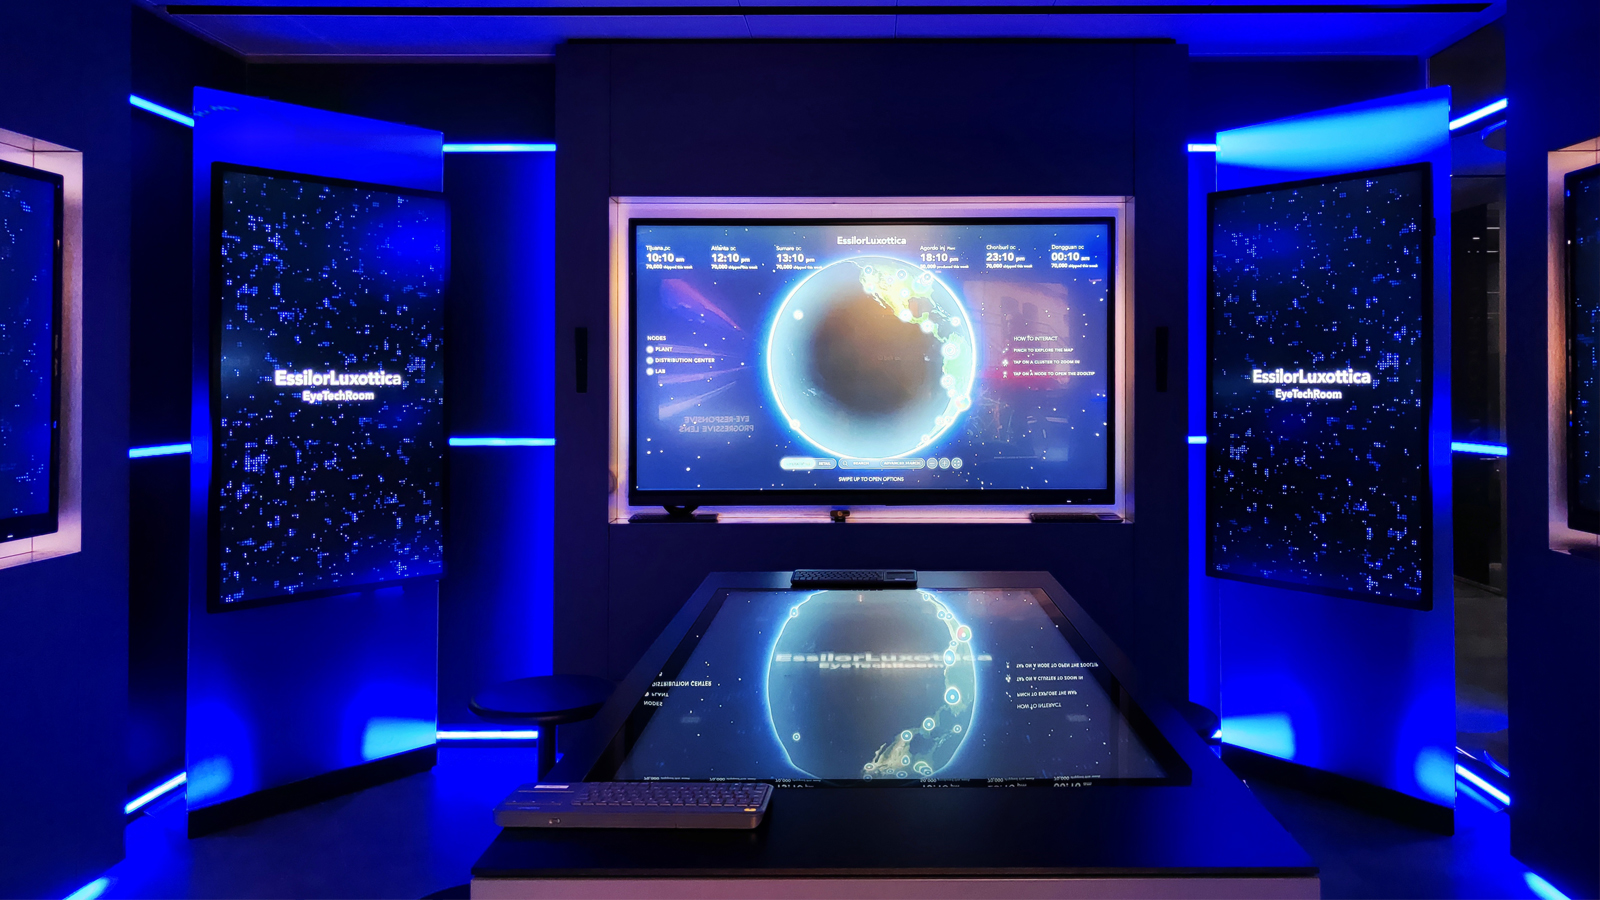
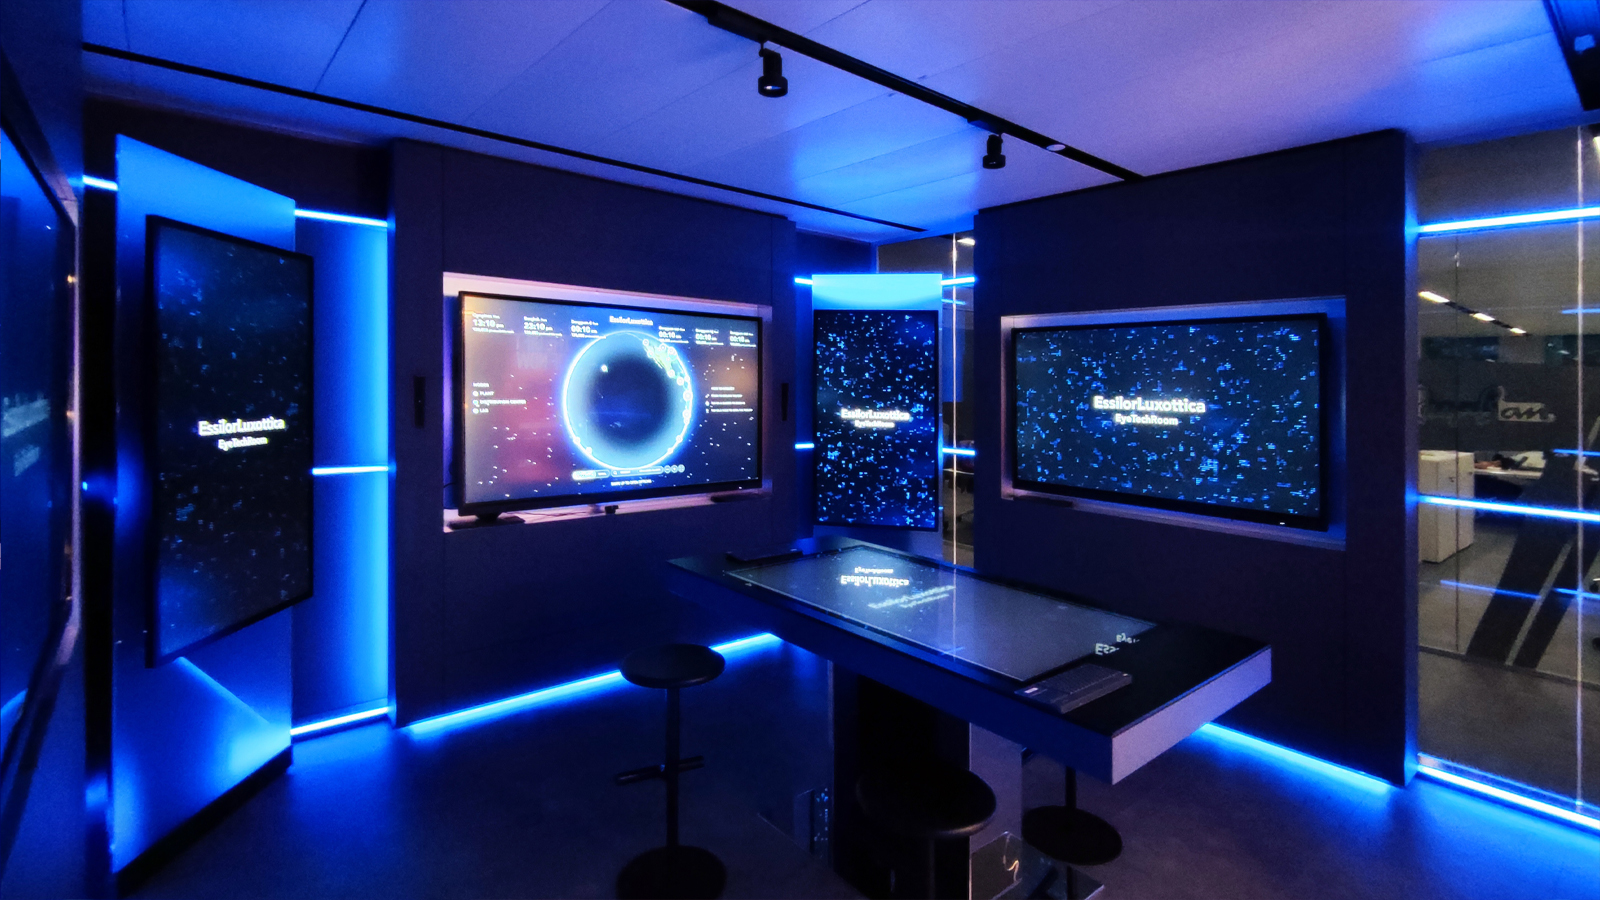
Typical environments where interactive technology meets data analysis include Data Decision Rooms, which range from traditional meeting rooms to more advanced control rooms. These spaces integrate 3D Data Visualization techniques with interactive display systems, providing tools for deep and immediate understanding.
Through 4K multi-touch displays, Touchwalls, immersive solutions, and integrated audio-visual systems, these rooms become the corporate decision-making hub, enabling decision-makers to identify phenomena, correlations, and synergies that might otherwise be difficult to detect at first glance.
Touchwindow has the expertise to design and implement complete technological setups for data visualization, interaction, control, and intuitive understanding.
Touchwindow’s solutions include integrated and immersive digital environments that feature specific hardware and AV infrastructure, and software applications for big data analysis and visualization, allowing for user interaction.
Touchviewer, real-time collaboration software with a dedicated module for 3D Data Visualization, aggregates large datasets and displays them as charts, maps, and tables for immediate understanding.
The key features that make Touchviewer the ideal software application for Data Visualization include the following:
Customizable Smart Dashboards: All views, charts, and tables can be tailored to users’ needs.
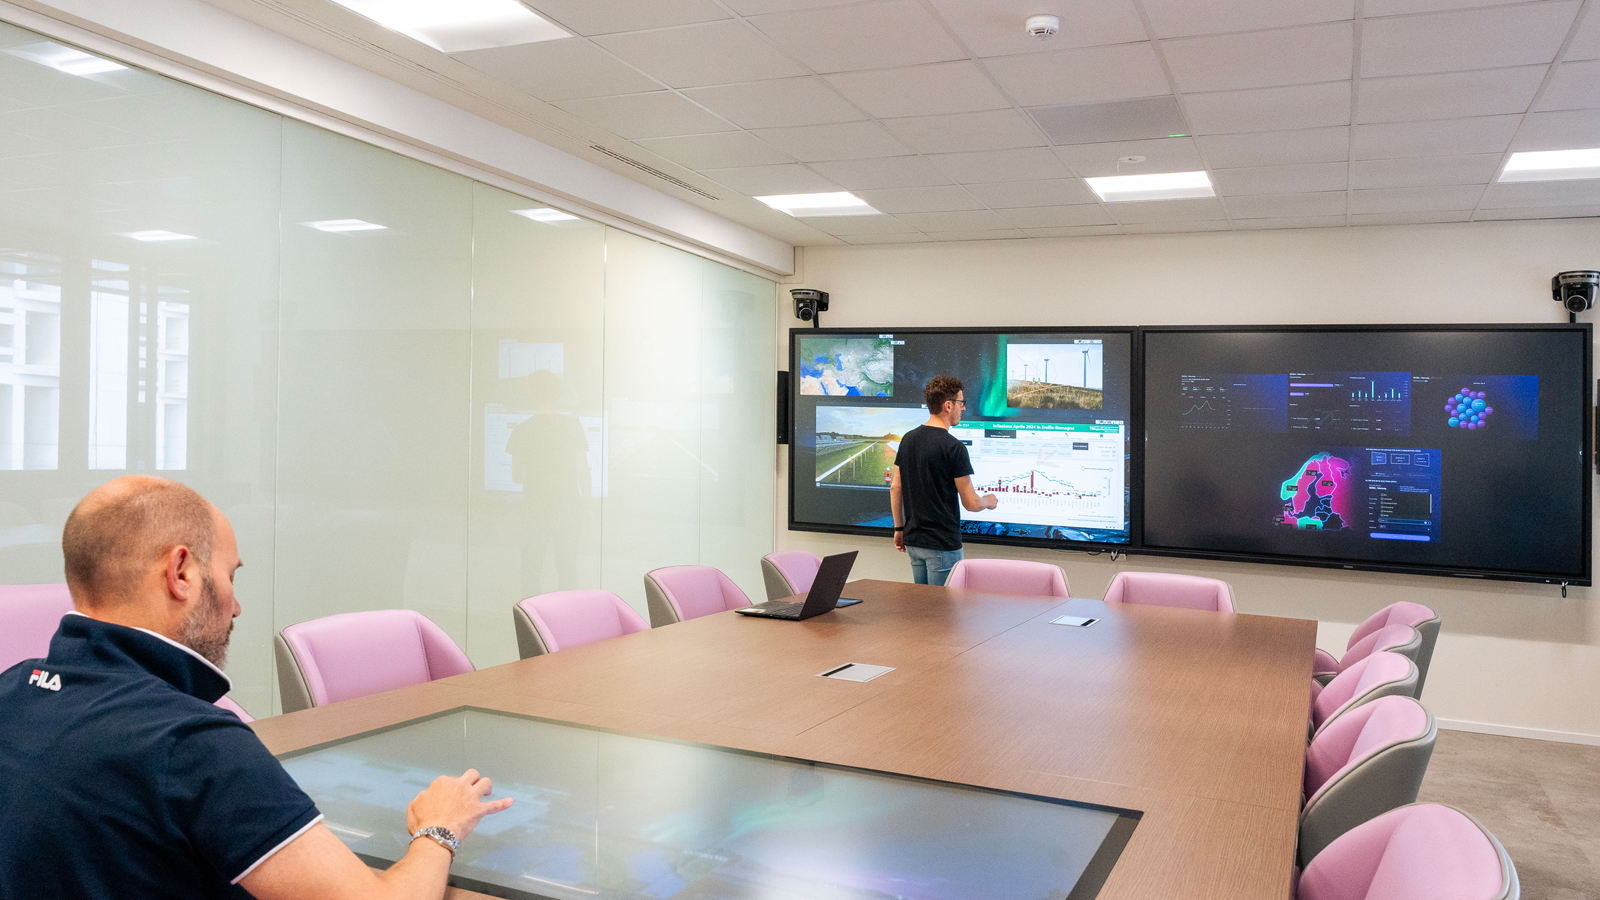
We design Meeting Rooms that integrate AVC hardware, software and automation solutions to physical environments, dedicated to sharing, collaboration and comparison.
Solutions that monitor processes and acquire data to increase efficiency and security.

The Emilia-Romagna Region expressed the need to create a Data Driven Decision Room to offer operational structures a new and innovative way to interact with the large amount of data available, make complex decisions with the help of 3D Data Visualization, and support administrative actions through easily comprehensible dashboards and images.
Tozzi Green entrusted us with digitizing workspaces, to revamp the hall and meeting rooms with new hardware and software solutions suitable for maximizing team sharing and collaboration.